

How to Evaluate a County Market Without Guesswork
You’re about to drop serious capital or launch an outreach blitz in a new county. Relying on gut or scattered info? That’s a shortcut to wasted time and money. Real estate market analysis county investors depend on is about hard data — median prices, inventory, days on market, and growth trends — lined up to reveal if a market moves fast, rewards cash buyers, or hides motivated sellers.
Too often, investors jump into a market chasing headlines or overheard tips. That’s a costly mistake. The right county-level analysis slices through noise and points you to zip codes with real opportunity. This isn’t theory. It’s the numbers you need to vet before dialing property owners or signing purchase contracts.
What Data Points Tell You a County Is Worth Your Time?
Start with these core metrics. They form the backbone of any solid county market analysis real estate investors rely on.
- Median Home Price: Sets the baseline for deal feasibility. If the median is $450K and your rehab budget caps at $50K, you’re either targeting the wrong submarket or need a different strategy.
- Price Appreciation Rate: Look for at least 3-5% annual growth over 3-5 years. Flat or declining prices signal risk unless you’re flipping distressed properties heavily priced below market.
- Days on Market (DOM): A low DOM (under 30 days) means the market moves quickly — you’ll need faster offers and tighter timelines. High DOM suggests buyer leverage and more motivated sellers.
- Inventory Levels: Months of supply under 3 means a seller’s market. Over 6 months indicates buyer’s market conditions ripe for negotiations.
- Distressed Property Percentage: Foreclosures or REO properties over 5% can offer motivated seller density but may require more rehab capital.
- Cash Buyer Percentage: High cash buyer activity (30%+) signals investor-friendly markets with quick closes.
- Population and Job Growth: Counties growing 1.5-3% annually with expanding job sectors tend to sustain demand and price appreciation.
Where to Find Reliable County-Level Market Data
You’ll want to combine multiple sources for accuracy and depth.
- County Assessor’s Office: Public records offer ownership data, property tax info, and sometimes sales history.
- MLS Data: Goldmine for comps, days on market, and price trends. Access usually requires a license or subscription.
- U.S. Census Bureau: Provides demographic shifts, population growth, income levels, and employment stats.
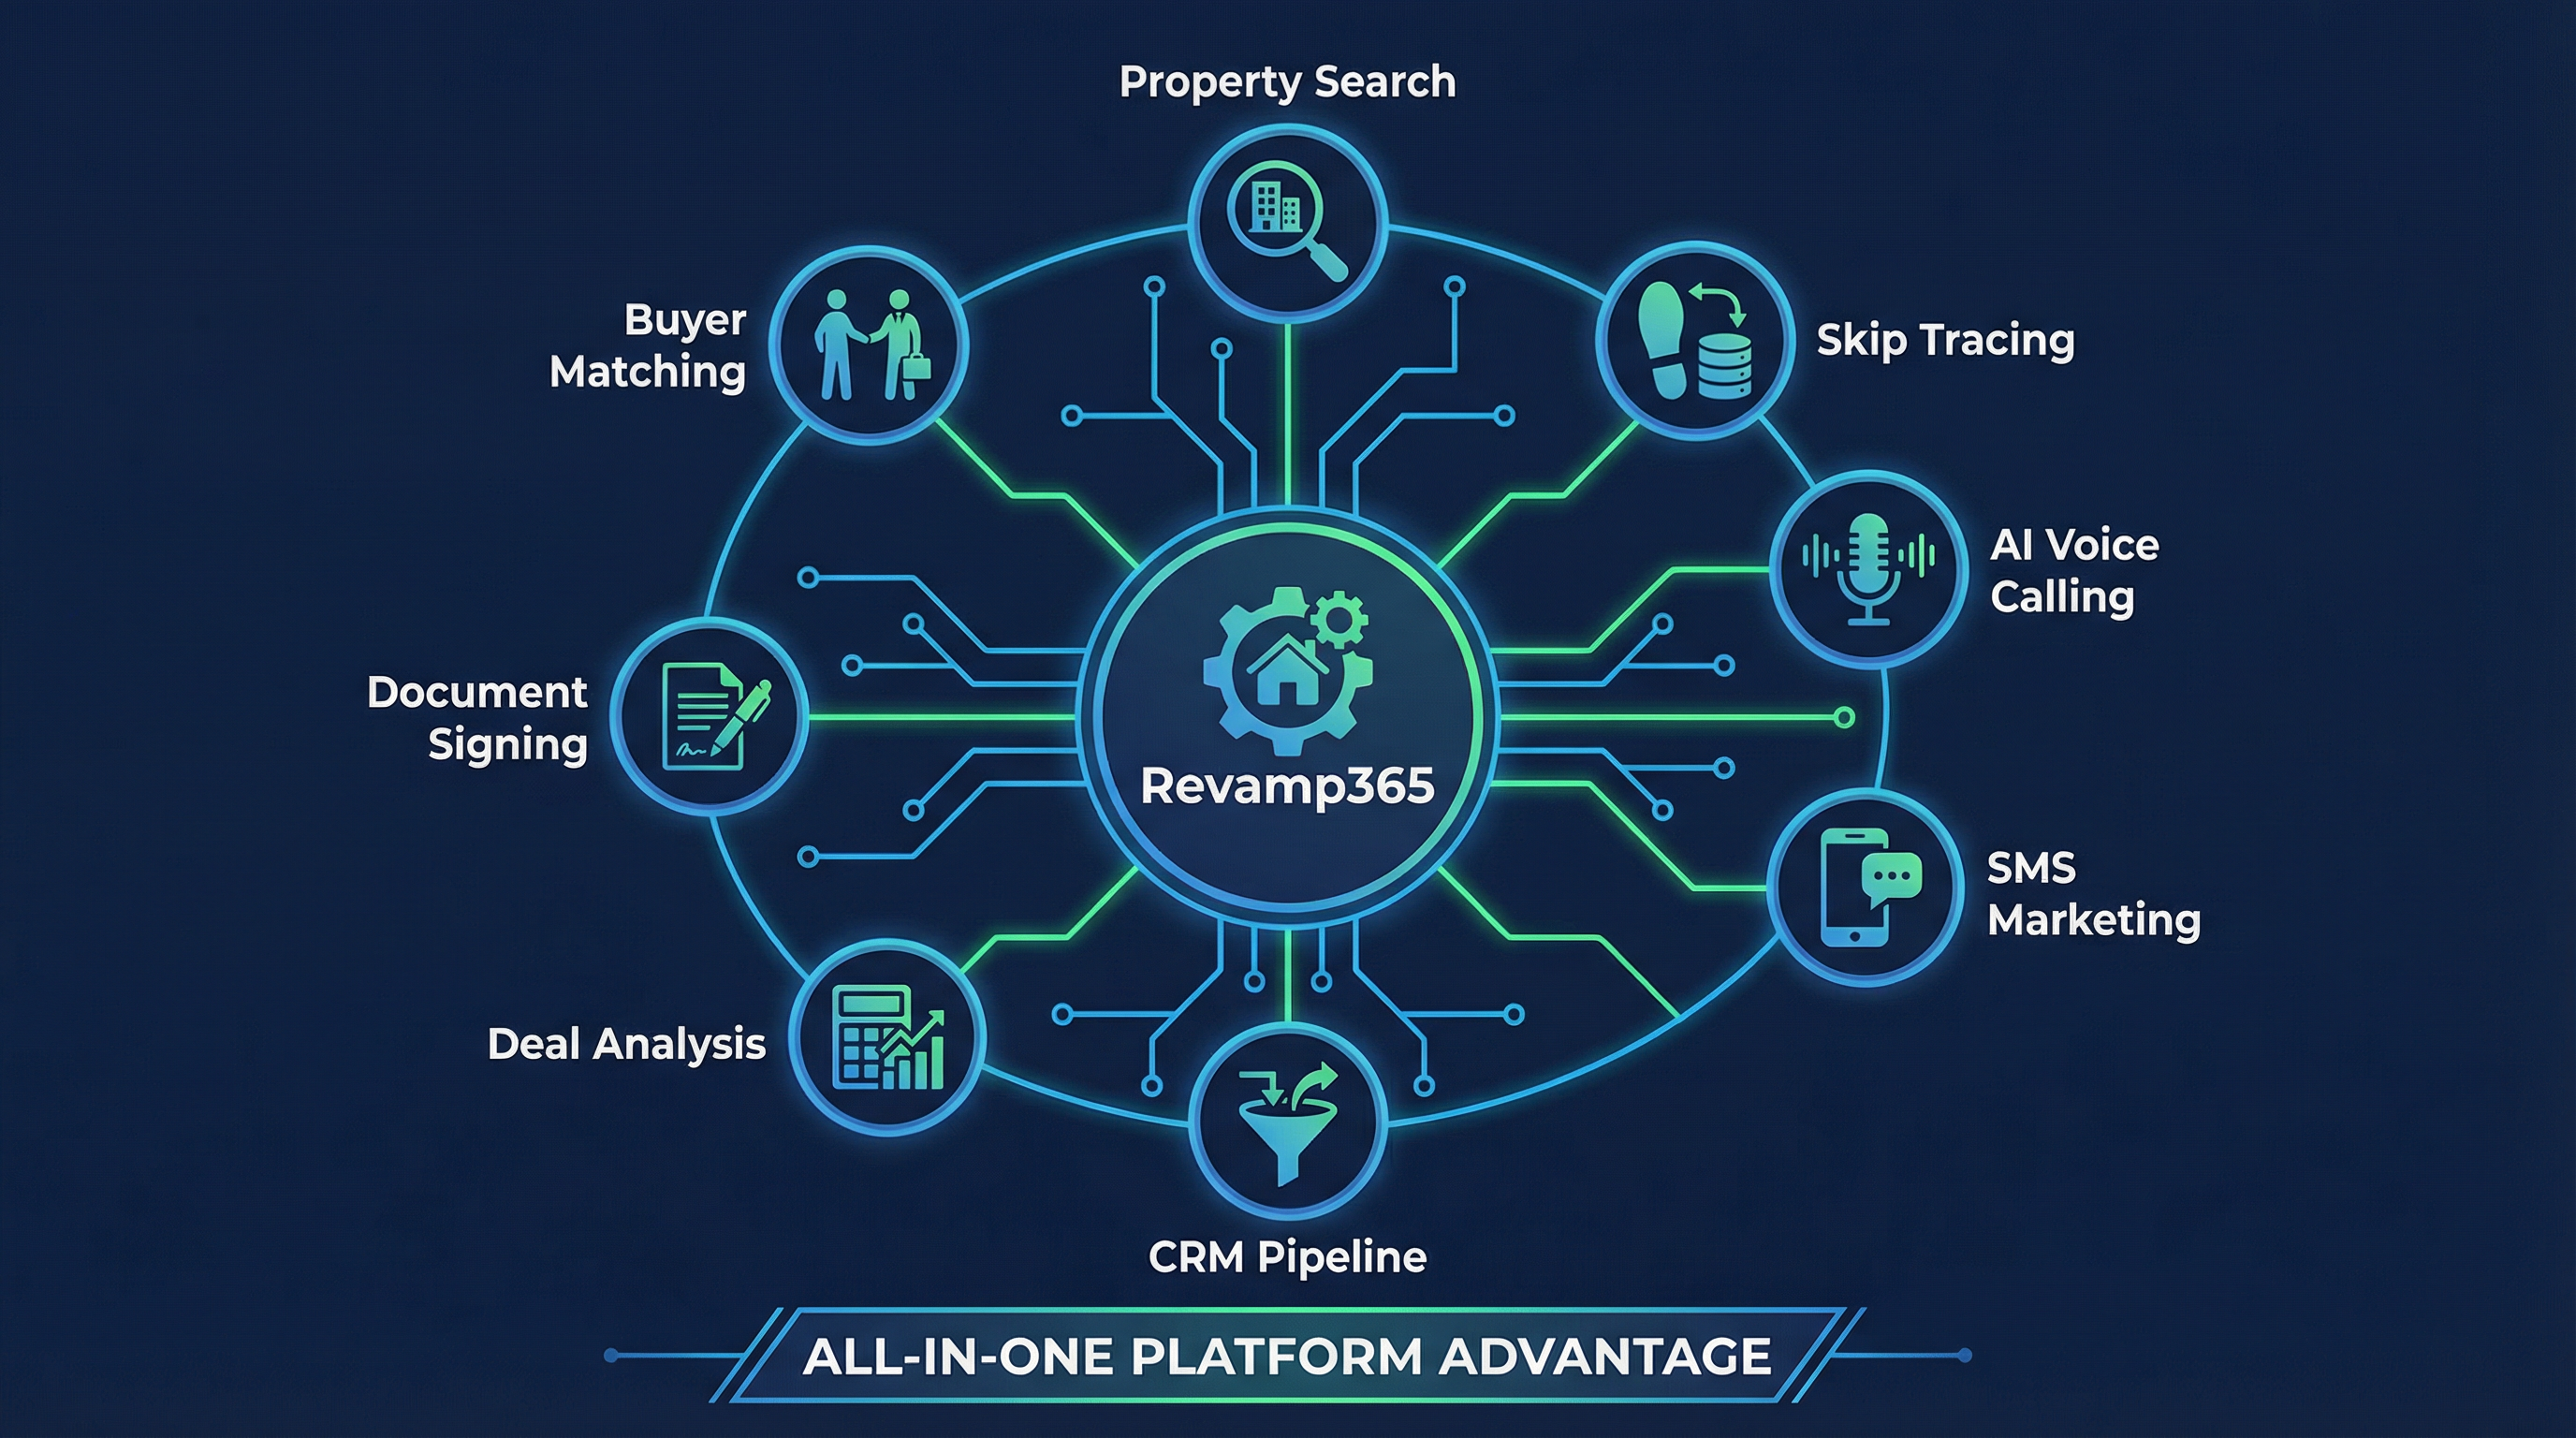
- Revamp365 County Data Subscription: For $20/month per county, get real-time MLS analytical data, AI-powered comps, and property market trends without a broker license or manual digging.
Revamp365 integrates these data points into a user-friendly dashboard that updates daily — saving you hours of research and enabling smarter deal flow decisions.
How to Interpret Key Market Metrics for Deal Viability
Numbers are useless if you can’t translate them into actionable insights.
- High Median Price + Low Distressed Inventory = Focus on Buy-and-Hold or Luxury Flips. Not ideal for wholesalers hunting bargains.
- Low Median Price + High DOM + High Distressed Inventory = Wholesaler’s Playground. You can find motivated sellers but expect longer hold times.
- Rising Price Appreciation + Declining Inventory = Time-Sensitive Market. Offers must be strong and quick. Consider leveraging cash-flow analysis to vet your exit strategies.
- High Cash Buyer Percentage = Competitive Investor Market. Prepare to move fast and possibly pay premiums.
Establish your risk tolerance and strategy first, then filter markets through these criteria. For example, if you’re a flipper with limited rehab funds, targeting a county with median prices under $300K, 4-6% annual appreciation, and 5-7% distressed properties will yield better deal flow.
How to Pinpoint the Best Zip Codes for Motivated Sellers Within a County
Counties are broad. Drill down to zip codes or neighborhoods that align with your criteria.
- Use Distressed Property Concentration by zip code. Revamp365’s analytics flag these hot spots.
- Cross-reference Days on Market by zip. Longer DOM in a zip code hints at seller motivation.
- Check Cash Buyer Activity zip code by zip code to identify where investors are active or where you face competition.
- Overlay Population Growth and Job Trends. Zip codes with declining population and jobs often harbor motivated sellers but come with risks.
For example, a county’s overall median price may be $400K, but two zip codes at $280K and $320K with higher distressed inventory and longer DOM could be your sweet spot.
Setting Realistic Deal Expectations Based on Market Conditions
Your projections depend on how well you align your deal criteria with market realities.
- In fast-moving markets (DOM < 20 days), expect fewer lowball wins. Budget 5-10% above comps for initial offers.
- In buyer’s markets (inventory > 6 months), sellers may accept offers 15-25% below market value.
- Adjust rehab budgets based on local labor and materials costs, which can vary county to county.
- Factor in holding costs tied to market speed. Longer DOM means more carrying costs — calculate using ARV calculator tools.
Set your minimum acceptable profit margins. For example, a fix-and-flip in a $300K median market might aim for a minimum 20% ROI after all costs.
Common Pitfalls in County Market Analysis and How to Avoid Them
- Relying on Outdated or Incomplete Data: MLS data changes rapidly. Using stale info leads to bad assumptions. Use subscriptions like Revamp365 for fresh analytics.
- Ignoring Local Economic Trends: Population decline or job losses aren’t reflected immediately in prices but predict market downturns.
- Overlooking Submarket Nuances: Treating a county as homogeneous masks high-opportunity zip codes.
- Misreading Days on Market: A high average DOM might skew from a few bad listings. Look at median DOM and distribution.
- Skipping Cash Buyer Analysis: Not knowing investor activity levels can cause surprise competition.
Avoid these by layering data from multiple sources, running your own comps, and validating assumptions with boots-on-the-ground intel.
Using Revamp365 to Streamline Your County Market Research
Revamp365’s county data subscription is designed for investors who want instant access to MLS-level analytics without the hassle. At $20/month per county, it’s the most cost-effective way to get:
- Daily updated median prices, appreciation rates, and DOM stats
- AI-powered comps that factor in distressed and cash sales
- Heat maps to identify motivated seller clusters by zip code
- Inventory and cash buyer activity percentages in easy dashboards
This data plugs directly into your deal underwriting process. Before launching a cold outreach campaign or writing offers, you’ll know exactly where to focus and what to expect.
How to Build a County Market Analysis Scorecard
Create a simple scoring system to compare counties objectively. Assign points based on thresholds:
| Metric | Ideal Range | Points |
|---|---|---|
| Median Home Price | $150K - $400K | 10 |
| Annual Price Appreciation | 3% - 7% | 15 |
| Days on Market | 20 - 40 days | 20 |
| Inventory Levels | 3 - 6 months supply | 15 |
| Distressed Property % | 3% - 7% | 15 |
| Cash Buyer Percentage | 20% - 40% | 15 |
| Population & Job Growth | 1.5% - 3% annual growth | 10 |
Counties scoring above 75 points warrant deeper due diligence and outreach.
Challenge Yourself: Take Your Next Market Analysis Beyond Surface Data
You have the tools and framework to evaluate any county with precision. Don’t settle for broad strokes or guesswork. Use data to filter markets, pinpoint motivated sellers, and set realistic deal expectations. The more disciplined your approach, the faster you scale.
Investors who master real estate investment market research win by moving first, moving smart, and moving confident.
Start your first county analysis with Revamp365’s $20 data subscription now
The largest database of curated off-market deals in the nation.
Claim Your AccessFor deeper analysis, check out our guides on how to identify hot markets, mastering the BRRRR strategy, and running a precise cash flow analysis.